What Does AI Actually Say About Your Brand?
TL;DR
Whether AI mentions your brand, what it says, and which pages it cites are separate questions. This guide uses BrandGEO's Overview to read a recorded answer with its platform and date, inspect summary metrics, and interpret trends. When there are too few observations, treat the result as a sample.
What AI Thinks of You May Not Match Reality
Have you ever typed your brand name into ChatGPT? If you don't run a company the size of Apple or Nike, the answer probably surprised you — outdated information, mixed-up product details, or no mention of you at all.
This isn't anecdotal. SparkToro partnered with Gumshoe.ai to run one of the largest publicly documented AI recommendation consistency studies: 600 volunteers ran 12 identical prompts across ChatGPT, Claude, and Google AI a total of 2,961 times. [1] The finding was stark: when you ask the same question 100 times, the probability of receiving the same brand list is less than 1%. Factor in ordering, and the probability drops below one in a thousand.
In other words, AI isn't a scoring system that assigns your brand a fixed rank. It's more like a shop assistant who re-decides who to recommend every time someone walks in.
How unstable is this? SE Ranking tested 10,000 keywords in Google AI Mode and ran each query three times on the same day. Only 9.2% of cited URLs remained consistent across the three runs; in 21.2% of cases, there was zero URL overlap between responses. [2] A separate study found that only 30% of brands remain visible from one AI answer to the next, and only 20% stay present across five consecutive runs. [3]
The problem goes beyond whether you're mentioned at all. BrightEdge research found that Google AI Overviews is 44% more likely than ChatGPT to mention a brand negatively. [4] The triggers differ too: Google's negative mentions are typically driven by news events — lawsuits, data breaches, product recalls — while ChatGPT is more likely to express reservations in evaluative "is it worth it?" queries. Spotlight analyzed over 1.8 million AI responses mentioning brands and found that 80.6% were neutral or positive, but the remaining 19.4% were negative or critical. [5] If you don't know what AI is saying, negative content shapes potential customers' perceptions without your knowledge.
"Thinking of AI tools as consistent sources of truth is provably nonsensical." — Rand Fishkin, Co-founder of SparkToro [1]
You might think: if AI answers are this unstable, why bother tracking them? The opposite is true. Because individual responses are random, you need to track the pattern across many responses — not snapshots. SparkToro's research also found something encouraging: while single answers are highly random, when you run the same category of question 60–100 times, the brand's "visibility percentage" stabilizes. [1] In the headphone category, Bose, Sony, and Apple maintained appearance rates of 55%–77% regardless of how the question was phrased.
This means you don't need to obsess over whether AI mentioned you this one time. What you need to track is your brand's appearance rate across enough responses, and whether that rate is trending up or down.
As Similarweb CEO Or Offer noted in the 2025 Generative AI Landscape report:
"Consumers are now starting their journeys inside AI assistants, shaping preferences and choosing who to trust before they reach any website." — Or Offer, CEO of Similarweb [6]
That's exactly what the Track dashboard's Overview tab helps you do.
Try It Manually First: What Does AI Currently Say?
Before diving into the dashboard data, run a manual test to build intuition.
Open ChatGPT (or Perplexity, or Google Gemini) and ask these three questions:
- "What is [your brand name]?"
- "Recommend a tool/brand for [your product category]"
- "How does [your brand name] compare to [top competitor] for [your typical customer]?"
Save screenshots of the answers. Then wait a few hours and ask the exact same questions again. Compare the two sets of responses — the brands mentioned, the sources cited, the wording used — and you'll likely find they've already changed.
This manual test teaches you two things. First, AI is indeed discussing your category (or not at all). Second, the answers genuinely shift between sessions. But the problem with manual testing is obvious — you can't run 20 questions across 5 platforms 3 times each, every day. That's why you need automated tracking.
If your website has already been audited through BrandGEO, the Track dashboard automatically runs a set of prompt probes after each audit, collects AI's raw answers, and displays them on the Overview tab.
Step by Step: Reading the Track Overview Tab
The Track dashboard lives at /site/your-domain/track and has five tabs: Overview, Prompts, Citations, Competitors, and Actions. Overview is the summary entry point — think of it as the "front page of the report card" for how AI sees your brand.
Three sections are displayed. Here's what each one shows and how to read it.
Step 1: Read the AI Verbatim Excerpt Card — What AI Actually Said
The most prominent area on the page is the AI verbatim excerpt card. It shows the complete original text of an AI response from a specific probe — not a summary, not a score, but the actual words AI used to talk about your brand.
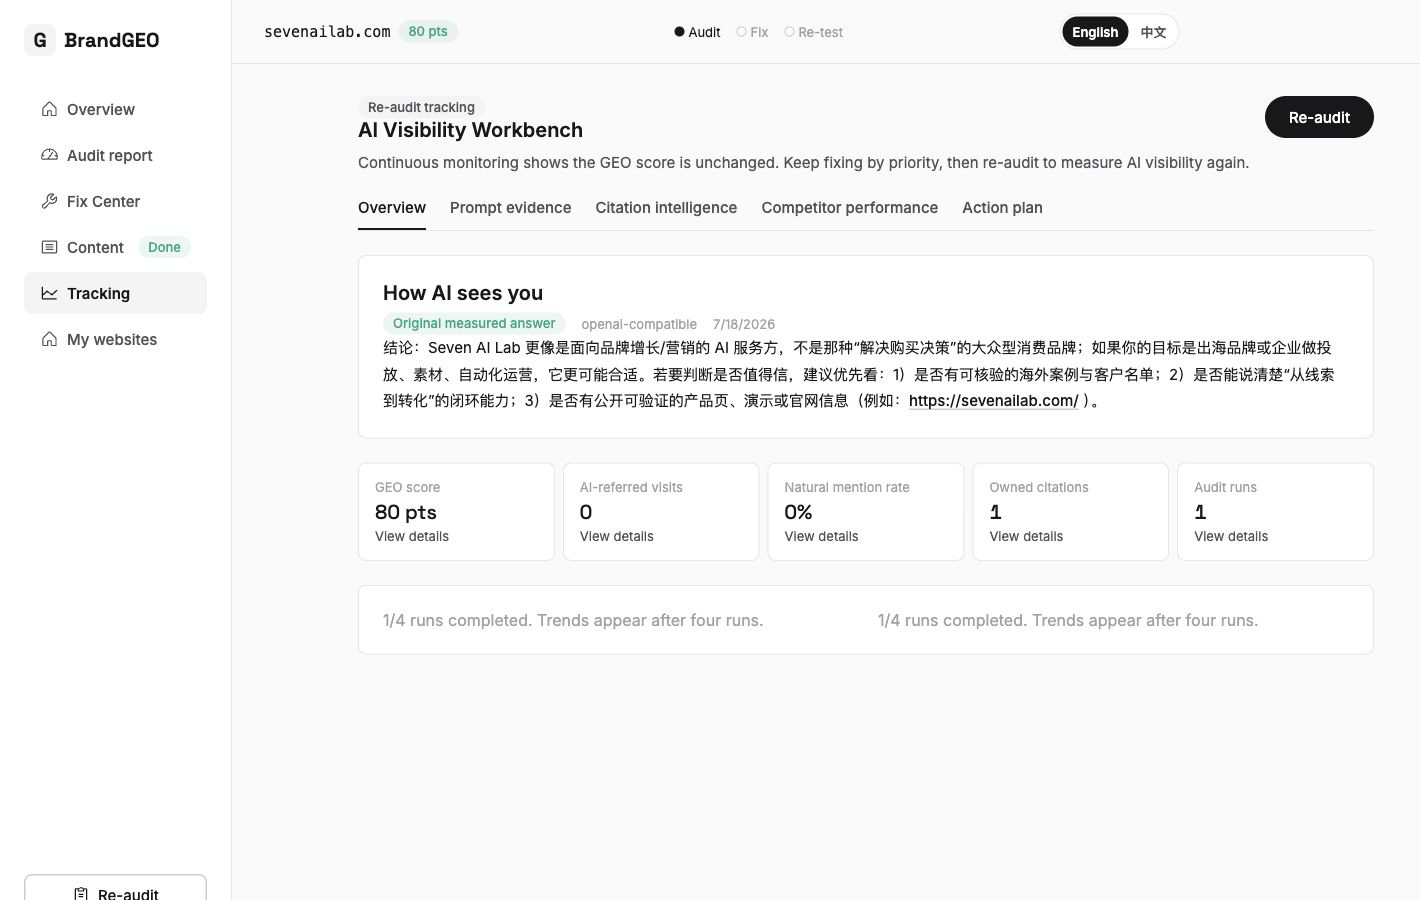 AI Verbatim Excerpt Card: displays the raw AI engine response, the source platform, and the probe date. What you see here is exactly what a user would see when asking that question in ChatGPT, Perplexity, or Gemini.
Three key pieces of information appear on the card:
Response text — The full AI answer. Check whether it mentions your brand name, whether the description is accurate, and where your brand appears in any recommendation list (first position versus buried at the end). Position matters — Vismore's 750-response audit found that a brand mentioned first was 3.1× more likely to get a click-through than one listed fifth or later. [6]
Source engine — Which AI platform generated this response (ChatGPT, Perplexity, Gemini, etc.). Different platforms behave very differently. The same set of prompts showed citation rates varying by 3× across engines: Google AI Overviews at 71%, Perplexity at 62%, ChatGPT at 41%. [6]
Probe date — When the response was collected. Since AI answers shift constantly, the date helps you assess how current the information is.
When reading this card, focus on three things:
First, whether you were mentioned. If AI answers a question directly related to your category without mentioning you, it means you're "invisible" to AI on that topic. Research shows that on unbranded prompts, the average mention rate for any single brand is just 0.34%. [7] Being mentioned at all puts you ahead of most competitors.
Second, whether the description is accurate. Vismore's audit found that 11.2% of brand mentions contain at least one factual error — most commonly outdated pricing or deprecated features. [6] If AI says your product costs $99 when it's actually $149, or claims you don't support a language you've supported for years, this misinformation directly affects potential customers. This is exactly why building a brand profile matters — it gives AI reliable facts to work with.
Third, the sentiment. Is AI recommending you, describing you neutrally, or flagging concerns? Spotlight's analysis shows ChatGPT's positive-to-negative ratio is approximately 27:1, while Google AI Overviews sits at 21:1. [4] If you see negative framing, it's a signal to prioritize improving your structured brand information and third-party review presence.
Step 2: Read the Five Summary Metrics — Your AI Visibility at a Glance
The verbatim excerpt tells you "what AI said." The five summary metric tiles tell you "how things look overall." These five numbers are the core dashboard you should check regularly.
 Five metric tiles: quickly grasp your brand's overall AI performance. Click any tile to jump into the corresponding detail Tab for deeper analysis.
Here's what each metric means:
Score — An aggregate assessment of your brand's visibility across AI search. It combines multiple probe results into a single number for comparison across time periods. Industry frameworks like the AI Visibility Score (AVS) typically weight mention rate, position quality, citation rate, sentiment index, and share of model. [6]
AI Recommendation Count — Across all probe questions, how many times AI explicitly recommended or mentioned your brand. Keep in mind that "mention" and "citation" are different concepts. A mention means AI wrote your brand name in its answer; a citation means AI linked to your website as a source. Mentions shape perception; citations drive traffic — track both separately.
Organic Mention Rate — The percentage of unbranded prompts (questions that don't include your brand name) where AI naturally mentions you. This is the best indicator of whether AI proactively recommends you. Research shows the average mention rate on unbranded prompts is just 0.34% for any single brand. [7] If your organic mention rate is above category average, you have a place on AI's shortlist.
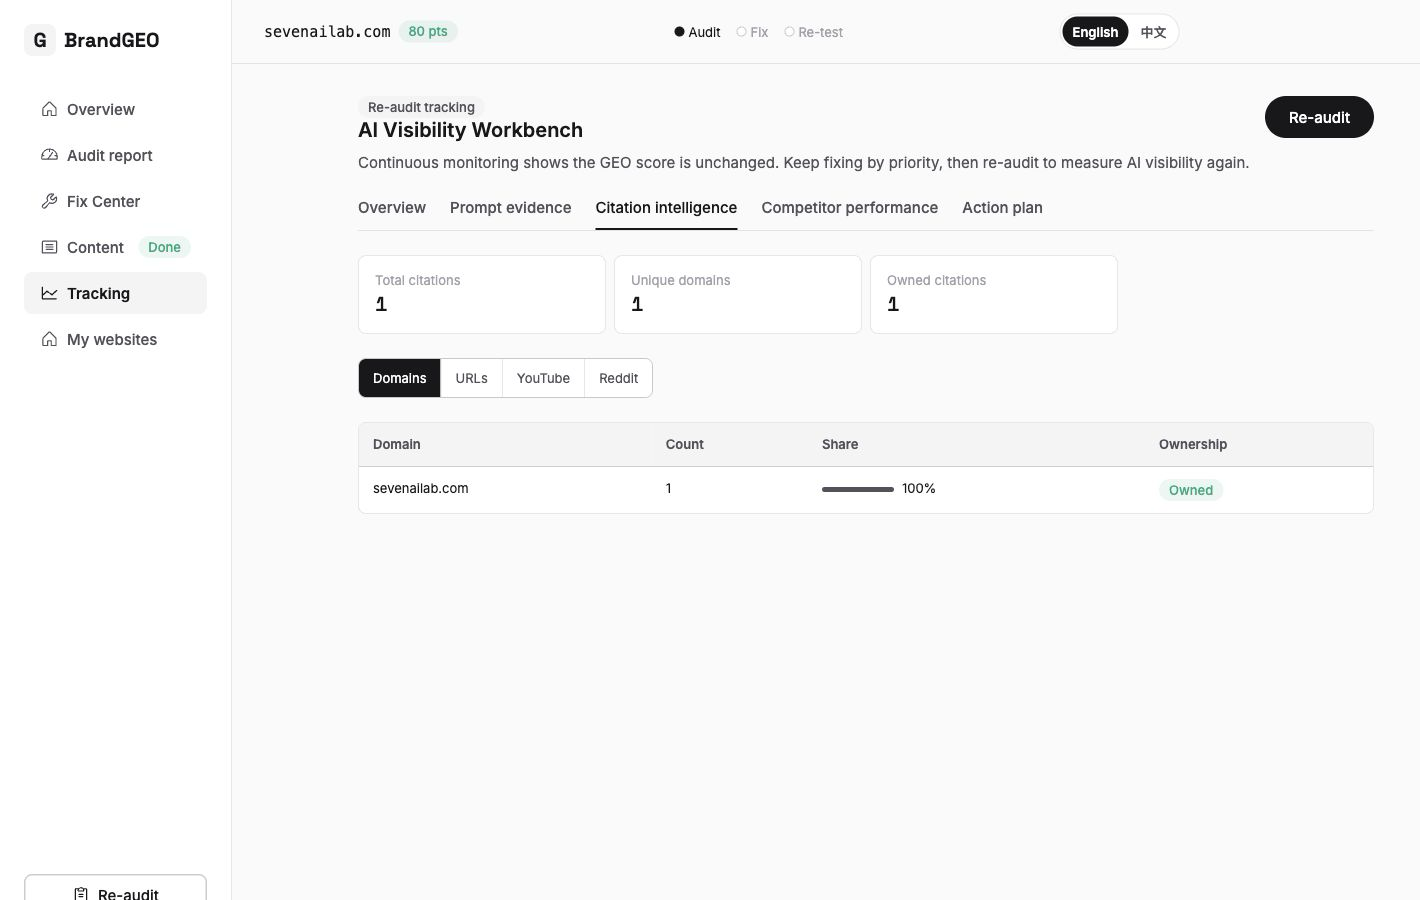
Owned Citation Count — How many times AI cited your own website (as opposed to third-party sites) as a source. Muck Rack's 2026 analysis of 25 million cited links found that 84% of AI citations point to earned media sources — not owned content. [8] So don't expect AI to primarily pull from your site. But tracking changes in this number tells you whether your content optimization efforts (like adding FAQ pages or updating technical foundations) are working.
Audit Count — How many audit rounds you've run. This matters because data volume determines trend reliability. SparkToro's research recommends at least 60–100 probes for statistically stable visibility percentages. [1] The dashboard will prompt you to "run N more audits to unlock the trend chart" when there aren't enough data points.
Each metric tile is clickable, taking you to the corresponding detail tab. For example, clicking "AI Recommendation Count" jumps to the Prompts probe library, where you can see AI's raw answer for every individual question.
Step 3: Read the Dual Trend Lines — Direction Matters More Than Numbers
At the bottom of the Overview tab is a dual trend line chart showing two curves: score trend and mention rate trend.
Dual trend lines: the blue line tracks your composite score over time, and the green line tracks your mention rate. Direction matters more than absolute values — if both lines are heading up, your optimization efforts are working.
Why trends matter more than snapshots: The high randomness of AI responses means any single data point is noise. The same question asked three times on the same day produces a different brand list 38% of the time. [6] Only by stringing together multiple audits into a trend can you distinguish genuine progress from random fluctuation.
When reading the trend chart, focus on three things:
Direction: The overall trajectory of both lines. If you made technical fixes or content optimizations, observe whether the trend changes instead of assuming it will rise. One practitioner guide cites cases improving within 60–90 days,[9] but it is not a 30%–40% benchmark for every brand.
Whether score and mention rate move together: If the score is rising but mention rate is flat, it might mean your technical foundations are improving (AI can read your site better) but that hasn't yet translated into more brand recommendations. At this point, check competitor comparison data to identify what information sources competitors have that you don't.
Threshold prompts: If you've only run one or two audits, the trend chart area will show "Run N more audits to unlock trend chart." This isn't a bug — the dashboard is protecting you from drawing incorrect conclusions from insufficient data. Following research recommendations, run several audit rounds before interpreting trends.
What You'll See After This
After spending five minutes on the Overview tab's three sections (AI verbatim excerpt → five summary metrics → trend chart), you'll have a clear big-picture view of your brand's situation in AI search:
- Whether AI is talking about you (the excerpt card tells you)
- How often and how accurately (the five metric tiles tell you)
- Whether things are getting better or worse (the trend chart tells you)
If trends aren't looking good, Overview is just the starting point. From here, you can drill into deeper analysis:
- Want to know which specific questions AI mentioned you on and which it didn't? → Click Prompts probe library
- Want to know which of your pages AI actually cited? → Click Citations source library
- Want to know whether AI chose you or a competitor for the same question? → Click Competitors comparison
- Want to know what to optimize next? → Click Actions priority plan
Overview data updates automatically after each audit. If you've just completed a round of fixes — added llms.txt, added FAQ pages, updated your brand profile — coming back to see whether the Overview trends changed is how you validate whether your work made a difference. This is the core of the "re-audit" step in the entire GEO closed loop: fix → re-audit → check Overview trends → decide next steps.
The complete Overview page: see everything AI thinks about your brand on a single screen.
Frequently Asked Questions
AI got my brand information wrong. What can I do?
This is common. Vismore's audit found that 11.2% of brand mentions contain at least one factual error. [6] You can't directly "correct" AI — it's not a database you can edit. But you can improve AI's information sources: make sure your website has accurate, structured brand information (build a brand profile), add schema markup to help AI understand your products more accurately, and maintain consistent brand descriptions on third-party platforms AI frequently cites (Reddit, Wikipedia, G2, and review sites).
Why does the AI verbatim excerpt show something different each time?
Because AI models are inherently probabilistic — they "re-sample" every time they generate a response. SparkToro's research confirmed this: even under identical conditions, AI source citations and brand mentions overlap only 34%–42% between consecutive days. [1] This isn't a dashboard issue; it's how AI fundamentally works. It's also why you should focus on trends rather than individual snapshots.
How often should I check Overview?
After each audit, with a minimum weekly cadence. Research shows that weekly 7-day rolling averages are the most reliable reporting period — much less noisy than daily data, yet more responsive than monthly reporting. [6] If you're in the middle of an intensive optimization push (for example, you just added llms.txt or updated your FAQ pages), check back one to two weeks after the changes to see whether trends have shifted.
I've only run one audit. Is the Overview data useful?
Yes, but interpret it cautiously. A single audit tells you what AI currently says about your brand (through the verbatim excerpt) and establishes baseline metrics (through the five tiles). But the trend chart needs multiple audit data points to be meaningful. The dashboard will prompt you when there isn't enough data. Run at least 3–5 audits before making trend-based judgments.
ChatGPT has 900 million weekly active users, but AI search traffic is still tiny. Is it worth the investment?
Yes. While AI search currently represents only 0.15%–0.25% of global internet traffic, the conversion rate tells a different story: visitors from AI search convert at approximately 7% on transactional sites, which is 4.4× the conversion rate of Google organic search. [6] And AI's influence extends far beyond direct traffic. Brand recommendations in AI answers shape user perception — even when users don't immediately click through, being mentioned drives a measurable increase in branded search volume 4–6 weeks later.
How do I know if my AI visibility is good or bad?
Look at Share of Model (SoM) — the percentage of brand mentions your brand receives out of all brand mentions across the same set of prompts. In Vismore's audit, category leaders averaged 22.4% SoM. [6] Above 18% is generally considered competitively strong. But the trend matters more than the absolute number — track whether your share is rising or falling over time.
Do different AI platforms give very different results?
Yes, dramatically so. Different AI models mention brands at strikingly different rates — Claude mentions brands in 97.3% of responses, while Google AI Overviews does so in only 48.5%. [10] ChatGPT accounts for 87.4% of AI referral traffic, [11] but Google Gemini's referral traffic grew 388% year-over-year. [6] This is why the Track dashboard's verbatim excerpt card labels the source engine — it helps you distinguish how different platforms see your brand.
What's the relationship between Overview and the other Track tabs?
Overview is the summary entry point. It shows the aggregated big picture — like a dashboard. When you spot a metric that needs investigation (for example, "why is my organic mention rate declining?"), click the corresponding tile to enter the detail tab: Prompts for per-question probe results, Citations for which pages AI cited, Competitors for competitive comparison, and Actions for action priorities. From big picture to detail — that's the recommended reading path.
Sources
- Fishkin, R. & O'Donnell, P. "Why AI Brand Recommendations Change With Every Query." SparkToro/Gumshoe.ai, 2025. Consistency study of 600 volunteers, 12 prompts, 2,961 AI responses. Summary
- SE Ranking. "AI Mode URL Consistency Study." 2026. 10,000 keywords, only 9.2% URL consistency across same-day triplicate queries. Summary
- AirOps. "The 2026 State of AI Search: How Modern Brands Stay Visible." 2026. 30% consecutive brand visibility data. Report
- BrightEdge. "When AI Goes Negative: Google AI Overviews vs ChatGPT." 2026. Negative sentiment comparison analysis. Report
- Spotlight. "Comprehensive Guide to Sentiment Analysis of Brand Mentions in ChatGPT." 2026. Sentiment distribution across 1.8 million AI responses. Article
- Vismore. "Best Ways to Track Brand Mentions in AI Search (2026 Guide + 750 Response Study)." 750-response audit covering citation rate variance, 38% variability rate, 11.2% factual error rate, AI Visibility Score framework. Report
- Search Engine Journal / Peec. "Prompt Tracking: Does prompt variance % impact brand mentions?" 2026. Average unbranded prompt mention rate of 0.34%. Article
- Muck Rack. "The State of AI Citations 2026." Across 25 million cited links, an average 84% pointed beyond brands' owned channels. Report
- Vismore. "Best Ways to Track Brand Mentions in AI Search." 2026. Practitioner guide citing several improvements in a 60–90 day window, not a universal growth benchmark. Guide
- Rocketblue. "Tracking Brand Mentions in AI Chatbots (Feb 2026 data)." Claude 97.3% vs Google AI Overviews 48.5% brand mention rates. Article
- Conductor. "2026 AEO/GEO Benchmarks Report." November 2025. ChatGPT accounts for 87.4% of AI referral traffic. Report
Last updated: 2026-07-23
What is AI saying about your brand? Open BrandGEO, run a free audit on your website → check the Track dashboard for AI's verbatim answers. Start your free audit